I was asked recently if there’s a way to shorten the period it takes to get used to unfamiliar waves… apart from surfing the feature and going through a process of success and failure, you can use video analysis, observing your performance post-session. This process benefits in avoiding making the same pattern of mistakes (that lead to failed tricks or preventable missed passes), and, of course, maximising your time and enjoyment on the wave. It’s aways worth having a strategy for getting the best from any river feature for that matter…
If you would like to try this approach here’s the fundamentals. If possible set-up the camera in a fixed position (ideally facing 45 degrees downstream) for a session or multiple sessions. Organise your video clips so that you can run through them with ease. Then set out a standard table template (keep it simple using paper or a spreadsheet) to capture the data you are seeking (e.g. the successful and un-successful setups, passes, tricks, flush’s, all against time). Then analyse the data you have acquired and present it on a basic wave map (example below), doing this will provide you a quick reminder of what needs to be considered and will also place the new information in the context of using the wave – aiding better retention of the insights you have gained.
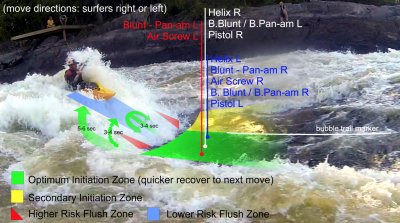
Screen shot taken from the 2015 World Championships Analysis of Garburator Wave, Ottawa, Canada.
What does this wave map tell us? Starting with the objective that (from a ICF competition point of view) there is only 45 seconds to perform as many high scoring moves as possible, time is an important factor. The diagram shows that if the athlete sets up at the top of the wave between the landing of each move, it would take an average of 5-6 seconds each time (which potentially equates to two lost moves). If the athlete uses the very edge of the shoulder (a small almost unnoticeable ledge a quarter of the way up the wave face, the set-up time drops to 3-4 seconds. It was also shown that landing tricks in the central zone of the wave often placed you straight into another set-up.
The area where the tricks are initiated (take-off) can also make a dramatic difference. The green zone would allow quick access to the right shoulder, whilst the bubble trail marks a small rise near the middle of the feature for generating more air. The yellow zone offers, big air potential, although showed higher flush rate, and longer set-up times. The red zones indicated, a high rate of flushing when landing tricks. Although subtle, the initiation point marked with the red, white and blue balls show high rate of successful executions for each of the tricks listed.
This is just a sample of what can be gathered, the key is to present what matters and not over complicate things. There are also a number of considerations such as, is the athlete able to make the suggested adaptions in the training time available? This is a very individual thing, and each athlete will need to refine their own approach to the features demands to suit their current ability level and/or style.
Taking this and applying it…the first things is to always start with a clear objective to your analysis. If it’s a competition then this would need to consider the rules, if it’s not then it may be just about speeding up your adaption to the feature. Either way, it’s always going to be around optimising the interaction of you and the feature. For example; Is it a surging or smooth wave? This may effect whether it’s more beneficial to throw tricks in the top quarter of the wave face, or throw tricks deep in the trough. This may become apparent watching a number of paddlers over a period of time, or through observing yourself initiating moves high or low on the wave, or using both. There are lots of factors like this to explore and this short article only scratches the surface. If you sit and watch for a while you will often start to see patterns emerging, recognising these patterns provides evidence that will be informative and shape your practice, and also increase confidence in your direction of thought.
Quick Summary:
1. Have a clear objective to the analysis
2. Prioritise key factors of performance
3. Devise a recording method that is efficient and easy to apply.
4. Present the data ensuring it’s easy to understand.
You must be logged in to post a comment.