3D kinematic analysis of Freestyle Kayaking: A comparison between manual and automated motion analysis techniques.
Abstract
Limited biomechanical analysis research has been conducted for freestyle kayaking. The purpose of this research was to determine if it was feasible to conduct automated three dimensional motion capture to obtain kinematic information on a freestyle kayak front loop in an outdoor white water environment. The aim being to identify if three dimensional motion capture could be utilised to assist coaches. Elite kayakers from the GB team participated in the research at the National Water Sports Centre, at Holme Pierrepont. Eight raptor-e cameras were used to capture the front loop motion. Markers were placed on the helmet, buoyancy aid, paddling cag, gloves, paddle and kayak. The markers on the participant were detected; however, there was a time delay in detection of the markers on the paddle and kayak following full submersion which impacted data analysis. Additional research is required to determine substances that improve the hydrophobic properties of the markers. The three dimensional data was compared to data obtained using manual digitisation techniques. The automated motion data capture system (Cortex) had a higher percentage of markers visible during the front loop motion than the manual digitisation technique (SIMI), and the body marker data was available for more of the front loop motion. The research suggests that it is possible to obtain useable data from an automated motion capture system in an outdoor white water environment.
Introduction
Canoeing/kayaking is one of four sports out of a total of thirty three (with Sport England targets) which has seen a dramatic increase in participation (up by almost 38% from 2005/6 to 2008/9) with the largest increases in the 16-24 age range (Sport England, 2009). Within this, white water freestyle kayaking is increasing in popularity. It is estimated that 4 million people participate in freestyle kayaking (Hyysalo, 2007).
Freestyle kayaking is a relatively new sport, being officially recognised as an official competition discipline by the International Canoe Federation (ICF) in 2006. As such, limited previous research has been conducted in the field of white water freestyle kayaking, and in particular, to 3D biomechanical analysis of freestyle kayaking manoeuvres such as a front loop.
The front loop can be considered to consist of four main phases


Figure 1, Key events of a front loop; 1) Set-up, the boat travels upstream with linear momentum, 2) Initiation, as the boat submerges the athlete begins to lean backwards, 3) Take-off, after a quick sit and reach the athlete tucks aggressively forwards to start the looping motion, this signifies the start of the flight part of the motion 4) Recovery, the athlete extends the body briefly to push down with their feet and complete the looping motion.
There is no current research into the kinematics of freestyle kayaking and comparisons have been taken from springboard diving (Sanders and Wilson, 1987; Miller and Munro, 1985).
To initiate the front loop and obtain maximum depth of kayak submersion the arms are swung upwards (flexion) as the legs are thrust downwards. This is similar to diving, where the downward thrust by the athlete onto the springboard produces flexion in the sprung surface and the recoil of the flexed surface helps drive the athlete in to the air (Carr, 2004). The arm swing by the diver during take-off provides momentum transfer to the diver’s body and adds to the downward thrust of the legs increasing the reactional force of the take-off surface acting upward against the diver. Miller and Munro (1984), in a study considering the body segment contributions to height achieved in springboard diving, suggested that arms account for 10% of the diver’s vertical acceleration. The kayaker uses downwards thrust to submerge the kayak and the resultant buoyancy force drives the athlete into the air. As the kayak is submerged the kayaker swings their arms to full flexion at take-off, again similar to the movement observed in diving.
The rotation is initiated as the upwards thrust of the buoyancy force does not pass through the athlete’s centre of gravity (CoG). The buoyancy force acting out of alignment with the CoG, causes an eccentric force (f), about a distance (d) from the axis of rotation resulting in a torque (f x d). Miller and Munro (1985). Hamill, Ricard and Golden (1986) suggested that arms are of particular importance in the development of angular momentum in springboard diving, especially in generation of rotation in low rotation dives.
To achieve this, as the athlete becomes airborne, the body position is changed to bring the paddle in towards the chest, with the shoulder abducted to 90º, externally rotated to 90º (in the frontal plane) and the elbow flexed to 90º. This swinging of the arms and shifting of the head also assists in promoting rotation.
Similar to vaulting somersaults, the sooner the athlete moves into the tucked position the sooner they will complete the required rotation (Takei, 2007) as the mass is more closely aligned with the axis of rotation (reducing the moment of inertia). During the flight of a front somersault dive, a diver can decrease their mass moment of inertia from approximately 15kgm2 to 6.5kgm2 by changing their body position from layout to pike (Hay, 1985). This reduction in the moment of inertia results in a proportional increase in total body angular momentum (Hamill et al, 1986).
The time of the flight is determined by initiating factors such as maximum depth obtained in submersion of the kayak (and hence maximal upwards momentum from the buoyancy force) and the compactness of the body shape adopted.
Recovery is described as the point at which the kayak stern first touches the water on completion of the flight. The angle of landing is again determined by initiating factors, as the flight path is set at take-off and cannot be changed in flight.
Limited biomechanical analysis research has been conducted for freestyle kayaking. As such there is limited 3D kinematic analysis to inform coaching practices. The purpose of this research (the research question) is to determine if it is feasible to conduct automated 3D motion capture to obtain kinematic information on a freestyle kayak front loop in an outdoor environment.
The aims of the research are;
- To investigate the effectiveness of calibration frames and markers in an external white water environment.
- To complete an analysis of the front loop techniques utilised by elite GB kayakers and provide coaching recommendations.
- To determine if the automated motion capture system could be used to provide coaching information and feedback in a shorter time frame than of manual digitisation techniques.
Automated motion capture and manual digitisation techniques
Many motion capture systems have been used to describe and measure human motion; such as optoelectric (Greaves, 1983), magnetic field (Luo, Niebur and An, 1996), accelerometric (Lafortune, Henning and Valiant, 1995) and photogrammetric (Shapiro, 1978). Of these, optoelectric has become the most commonly used method for measuring human motion. Optoelectric technologies identify retro-reflective markers and compute their position. The markers (generally discs, hemispheres or spheres with a retro reflective coating) are detected by infrared cameras which utilise infrared lights ringing the camera to cause the markers to contrast with the background. Three dimensional co-ordinates are calculated from this data if the marker is visible by two or more cameras. This form of analysis has proven accuracy and is accepted in the biomechanics field (Hatfield and Scheirman, 2010).
Although there is no evidence in the literature that three dimensional modelling has been conducted for freestyle kayaking, research studies using manual digitisation techniques have been conducted for other canoe/kayak disciplines. These include sprint kayak paddling (Baker, Rath, Sanders & Kelly, 1999). Here key markers on the knuckles, wrist, elbows, shoulders, and bow and stern of the kayak were digitised for analysis. Similarly Mann and Kearney (1980) used the wrist, elbow and shoulder to provide an analysis of the Olympic-style flatwater kayak stroke. Manual digitisation involves synchronising footage from a minimum of two cameras and analysing individual frames to describe the motion. This can be time consuming and involve significant lag periods between completing the data collection and providing feedback to participants. Richards (1999) suggested that these video techniques can have accuracies of 1mm, which can diminish if the system requires manual digitisation of the markers. By comparison, automated motion capture has the potential advantage of reducing the time from testing to provision of feedback and can yield sub-millimetre accuracy (Hatfield and Scheirman, 2010).
Automated motion capture (optoelectric) has historically been utilised in a controlled laboratory environment where possible reflections and excess lighting can be minimised and/or controlled. This is because the light from the camera infra-red ringing lights has been insufficient to distinguish the markers from background illumination and cameras have not had the ability to process the data resulting from the sunlight (Hatfield and Scheirman, 2010).
These automated motion capture techniques have been used in controlled laboratory motion analysis of kayaking using a paddling simulator (Limota, Squadrone, Rodano, Marzegan, Veicsteinas, Merati and Sacchi, 2010). There is no evidence of automated systems being used to analyse kayaking in the outdoor environment. However, Begon, Lacouture and Colloud (2008) used a semi automated motion analysis system to study kayak forward paddling in an indoor water tank.
Recent research (Hatfield and Scheirman, 2010) has utilised automated motion capture systems to analyse golf in the outdoor environment. This research suggests that it is possible for passive-based optoelectric motion capture systems to collect data outdoors in full sunlight, with comparable quality to data collected indoors.
To facilitate future research in the field of freestyle kayaking it is proposed to utilise both automated and manual techniques to analyse a front loop to allow comparison of their usage in an outdoor environment. The freestyle front loop manoeuvre was selected as it provides the basis for a number of other freestyle kayak movements (such as the Space Godzilla) and is contained within a set volume on a set feature on a moving river. This enables analysis equipment to be located in suitable positions to observe the complete motion.
This research will evaluate the use of automated optoelectric (Cortex) and manual motion capture systems (SIMI) in an external white water environment. It is predicted that both systems will provide usable data, sufficient to complete biomechanical analysis of a kayaking front loop and that the automated motion capture system could be used to provide coaching information and feedback in a shorter time frame than that of manual digitisation techniques.
Hypothesis:
H1 – It will be possible to collect 3D kinematic data using an automated (optoelectric) motion capture system in an external environment and this will enable feedback to kayak athletes in a similar or shorter timeframe than that of manual digitisation techniques.
H0 – 3D kinematic data collected using an automated (optoelectic) motion capture system will not have a reduction in feedback time versus manual digitisation techniques
The research will analyse data collected during testing to improve knowledge of the kayak freestyle front loop and inform coaching practices currently in use.
Markers
There is no evidence that the effectiveness of utilising markers to analyse freestyle kayaking in an external white water environment has been investigated. Previous research (Hunter, 2009) used manual digitisation techniques to investigate canoe slalom boat trajectory when negotiating an upstream gate. This research utilised soft fluorescent orange hemispherical markers, 40mm in diameter, which were fixed to the boat and head of the paddler (where they were clearly visible above the water line). As this research will involve submersion of markers in moving water it is proposed not to use soft markers which may suffer deformation under test conditions.
Begon et al (2008) utilised markers fixed to a wetsuit for their indoor on-water kayaking analysis. However it was noted in their discussion that it was likely that there was some relative motion of the wetsuit although it was assumed this error was small. It is proposed to fit markers to kayak clothing, rather than a wetsuit, during this research. As the clothing is tight fitting it has been assumed (based on Begon et al, 2008) that although there may be relative motion of the clothing versus the body will be small for close fitting clothing.
This research will consider the practicalities of utilising markers in an external white water environment (including methods of attachment of markers and movement of markers in the white water environment) and the impact of lighting upon observed results.
It is proposed to investigate the effectiveness of;
- Handmade versus proprietary markers.
- Marker coatings such as varnish and silicon to enhance the hydrophobic properties of the markers and reduce the time for the markers to be observed by the Cortex system following submersion in water.
It is hypothesised that the homemade markers will be as effective as proprietary markers and that the use of coatings will enable the markers to be observed in a time frame that allows meaningful biomechanical analysis of the front loop manoeuvre.
Calibration frames
The research aims to investigate the use of calibration frames in a white water environment. Pribanic, Peharec & Medved (2009) suggested that an accurately fabricated 3D calibration cage was generally regarded as the most reliable way to calibrate a camera. They proposed that when comparing the use of 2D plate calibration and wand calibration to 3D kinematic systems there was little difference observed in reconstruction accuracy and the wand was favoured based on qualitative issues (such as user friendliness during calibration).
Previous slalom research (Hunter, 2009), which investigated the canoe slalom boat trajectory of an upstream gate in an external environment, used a custom portable calibration rig. This consisted of a base frame, which was level at the base of the course with no water running and a moveable ‘T’ section that was attached to each corner of the base frame and levelled. Hunter (2009) recorded useful data using this calibration method. However, this method relies on the use of an artificial white water course to offer the facility to ‘switch off’ the water flow to allow the calibration frame to be located. This research aims to investigate the feasibility of utilising a hovering calibration frame (with water flow rate maintained) as compared to a calibration frame obtained when the water flow is stopped.
Pilot Testing
As research into white water freestyle kayak manoeuvres had not been conducted in the outdoor environment it was necessary to conduct pilot testing to inform full white water testing.
Methods
Marker detection post submersion in water
Pilot testing was conducted to determine the efficacy of the markers utilised by the Cortex system in a water environment. A purpose built test rig was constructed (figure 2) which allowed direct comparison between the time for Cortex to register a dry marker and a wet marker. One marker was obscured by a solid barrier and the other was immersed in water.
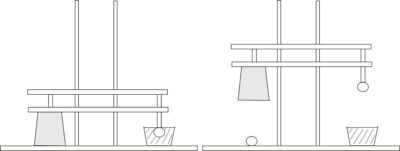
Figure 2 – Schematic of test apparatus to investigate the effect of marker coatings.
Upon the signal “go” the device was raised revealing both markers. A series of eight raptor-e cameras (figure 3) were positioned around the test apparatus and the time taken for the two markers to be observed was recorded. The test was repeated 10 times for each condition. Any marker which was not detected by the Cortex system after 3s was discounted from the trial, but logged as “not shown” against the trial.
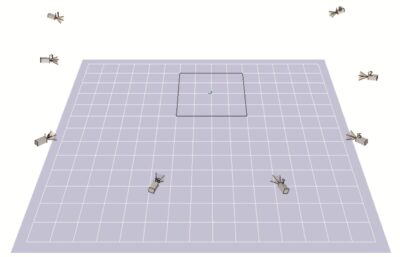
Figure 3 – Plot plan showing camera locations for marker immersion testing
A control test was also conducted without water to identify any differences in timing due to the experimental configuration which could then be discounted from the final results.
Marker adhesion testing
The white water environment is a harsh dynamic environment; as such it is important that the markers are firmly attached to both the clothing and the kayak. Several methods of adhesion were considered;
- Marker attached directly to kayak with evostick.
- Marker attached directly to polyethylene foam backing using evostick.
- Marker screwed to a polyethylene foam backing which is then attached to kayak with evostick.
Polyethylene foam (closed cell foam) was used as, in short-duration cyclic loading conditions, the thickness of the material recovers instantly and totally on removal of the load (Kuncir, Wirta and Golbranson, 1990)
These marker fixings were tested under simulated white water conditions using a high pressure water jet washer. Each arrangement was exposed to a water jet from a high pressure jet washer with a rated flow-rate of 300l/hr at a pressure of 90barg. The number of markers removed by the water jet in a 60second period was recorded.
Lab based testing
To avoid any unforeseen issues during full scale testing the experiment was replicated as much as practicable in the laboratory setting.
The venue chosen for the external white water testing was the inlet gate at the National Water Sports Centre, at Holme Pierrepont (HPP). To replicate the experimental arrangement in the laboratory, measurements were obtained from HPP (figure 4).
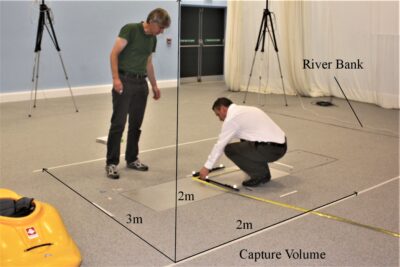
Figure 4 – Laboratory testing based on HPP top inlet gate arrangement.
This arrangement was then replicated in the laboratory setting, with eight cameras positioned as per the proposed arrangement for the external environment.
A kayak (Liquidlogic Biscuit) was utilised for the dry test. Markers were located on the kayak as follows; 10 on the bow (5 above and 5 below the water line) and 10 on the stern (5 above and 5 below the water line). The spherical markers were each glued directly to the kayak. The kayak was manually moved to mimic the front loop motion. The camera data was reviewed to verify that the whole motion was within the camera range of view.
The dry trial also identified a number of reflective objects on the kayak (such as grab handles) which required taping to reduce reflection.
Results
Marker testing
Handmade markers were constructed of 16mm diameter cork balls (normally used for fishing) which had been coated in 3M reflective tape. Plastic bearings and spherical buttons were considered as alternatives to the cork balls but were discounted due to cost and the ease of fixing the cork balls to a solid backing. Cork also has the advantage of being impermeable to water (Silva, Sabino, Fernandes, Correlo, Boesel and Reis, 2005).
The average time taken for the markers to be detected following submersion in water is shown in Table 1. The results showed that for the control test, conducted without water, the average difference in time to detect the two markers was 0.003ms. It was assumed that this was small enough to be assumed negligible for the purpose of the experiment. This meant that it was not necessary to apply a correction factor to account for the design of the experiment.
The average time to observe the wet proprietary marker versus the dry marker was 18.33ms. Analysis (SPSS) identified that there was a statistically significant difference between the time to detect the wet and dry (reference) markers (p=0.017). This suggests that there is a measurable time delay in detection of the markers related to their submersion in water.
The time to observe the ‘wet’ marker was reduced by the addition of hydrophobic coatings to the marker. The time to observe the ‘wet’ marker with no coating was 18.33ms compared to 0.08ms with the silicon coating for the proprietary markers. This was statistically significant (p= 0.017). Handmade markers were constructed for use in the outdoor testing. These were found to be observed after an average time of 4.05ms. This was noted as on average shorter than the proprietary markers. This could have been due to the construction (not being totally smooth) or potential cross contamination with the silicon used in earlier experiments. It is thought unlikely that cross contamination occurred as the water was changed between each trial, the experiment washed his hands after handing silicon markers and a different marker was used after each silicon trial (e.g., a silicon trial marker would not be reused in subsequent trials). A more likely possibility is that the 3M tape had a residual coating (following removal of the backing tape) which improved the hydrophobic properties.
The addition of varnish was found to have no negative impact on the average time taken to observe the marker. SPSS analysis of the time taken to detect the ‘wet’ handmade marker with no coating and the handmade varnished marker detected no statistically significant difference (p=0.933). This suggests that varnish could be used to provide a hardening coat to the markers to reduce the impact of wear, although it is realised that this will require further investigation to fully quantify.
The most effective marker coating at reducing the time for ‘wet’ marker detection was found to be a silicon coating (silicon spray lubricant). The silicon coating was sprayed on and wiped to remove any excess. An excess of silicon coating resulted in the marker had a negative impact on the time taken to detect the marker.
Table 1 – Time taken for marker to be observed by Cortex system for a range of conditions.
|
Average time to observe marker (ms) | |
|
Control test (no water) |
0.003 |
|
Marker , no coating |
18.33 |
|
Marker, silicon coating |
0.08 |
|
Handmade marker, no coating |
4.05 |
|
Handmade marker, silicon coating |
0.04 |
|
Handmade marker, varnish coating |
3.96 |
|
Handmade marker, varnish coating and silicon coating |
0.95 |
The testing of the marker adhesion methods identified that the optimum method of fixing the marker to the kayak was to screw the marker to a polyethylene closed cell foam backing pad and affix this to the kayak with evostick (Figure 5). This foam pad allowed a larger surface area for adhesion. Methods of direct marker adhesion (with a smaller surface contact area) resulted in the marker being dislodged by the water jet.
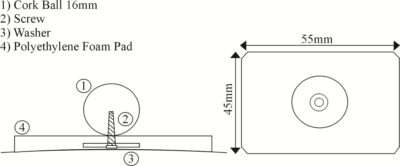
Figure 5 – Schematic showing the method of fastening the marker to the polyethylene closed cell foam.
A similar method was used to attach the markers to the clothing as it was identified that sticking patches of reflective tape onto the clothing was susceptible to loss of adhesion. The markers were screwed to the clothing with the foam pad being on the inside of the garment to provide protection against abrasion to the athlete. The markers were attached to the helmet and paddle in a similar method as for the kayak.
Full scale testing methods
Participants
The participants were senior members of the GB freestyle kayak team selected at random. Each elite paddler participated on a voluntary basis. The participants were aged 18-35 years old and were all capable of performing the front loop manoeuvre. Consent forms were completed by each participant (an example is available in Appendix II)
Equipment
Each participant was required to paddle a Jackson Rockstar kayak made of cross linked polyethylene. Due to the method of kayak construction, it was assumed that there was minimal to no deformation of the kayak material during the testing.
Markers, fabricated from 16mm cork balls coated in 3M reflective tape, were fitted to the kayak and the kayak software (paddling cag, helmet, buoyancy aid, neoprene gloves etc). The markers were located on the kayak as follows; 10 on the bow (5 above and 5 below the water line) and 10 on the stern (5 above and 5 below the water line). The spherical markers were each attached (screwed) to a polyethylene foam pad and glued to the kayak (as per figure 5). Figure 6 shows the locations of the markers on the kayak and paddle. The markers were deliberately placed in a random pattern to facilitate Cortex analysis.
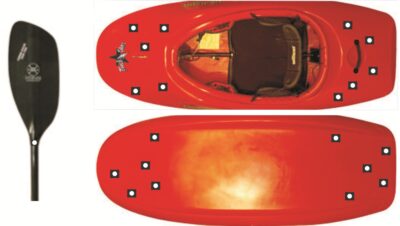
Figure 6. Arrangement of markers on kayak and paddle.
Two markers were added to the kayak paddle (front and back) at each end of the shaft, where the paddle blade joins the shaft. Hay and Yanai (1995) investigated the ability to predict the under-water motion of the blade from above the motion of the paddle shaft above the waterline. It was proposed to utilise a similar methodology during this research to infer the position of the kayak and paddle when underwater from the visible markers.
The following markers were used on the software;
Helmet; Three markers were used. These were located at the top of the head and on each side of the helmet.
Gloves; Three markers were attached to each glove, two at the wrist and one at the middle knuckle joint.
Bouyancy aid; Ten marker were attached to the buoyancy aid. Two (one left, one right) at the top of the shoulder straps, two (one left, one right) at the top and bottom of the main buoyancy aid front and back panels.
Thermal top: Four markers were attached to the thermal top. Two, on both the front and back, (one left and one right) to mark the anterior and posterior shoulder positions.
Elbow pads: Two markers each, to the medial and lateral elbow.
Thermal top: Four markers, to the left and right anterior and posterior shoulder.

Figure 7. Anatomical location of the participant markers used in analysis
Each kayaker was required to wear the same helmet and outer clothing to maximise the consistency of marker locations.
Procedure
The tests were conducted at the National Water Sports Centre, Nottingham Holme Pierrepont (HPP), on the top wave (hole) feature located at the inlet gate. This venue offered a number of advantages as it afforded easy access to both sides of the river and the flow of the river could be controlled.
The flow control aspect allowed two methods of calibration to be trialled for the Cortex (optoelectric system). The first method required the water flow to be stopped. The origin was positioned and fixed where the top of the normal level of flow would be (figure 8). A wand calibration was then performed by standing in the river where the feature would be (when normal flow was resumed) (figure 9).
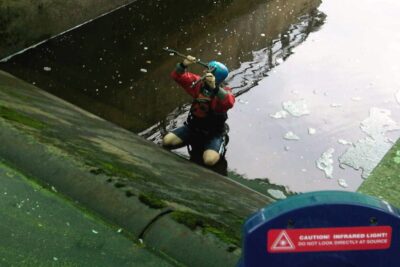
Figure 8 – Calibration using the L shaped seed in the no flow condition
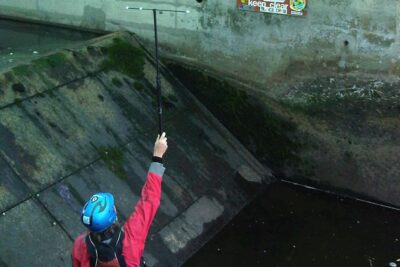
Figure 9. Calibration wand in the no flow condition
The second method (water present) involved keeping the flowrate at that normally observed and hovering the origin over the water feature and then using a combination of an experienced paddler and the bank support to carry out the wand calibration.
The hovering calibration frame was created by attaching markers to a piece of polyethylene closed cell foam. The markers were orientated to exactly match the calibration L frame. This polyethylene foam was then suspended at the water level using a rope arrangement. Individuals at each side of the riverbank held rope which supported the calibration frame as per figure 10.
The wand calibration for the ‘flow’ case was achieved by a kayaker holding the wand when surfing the wave (figure 11).
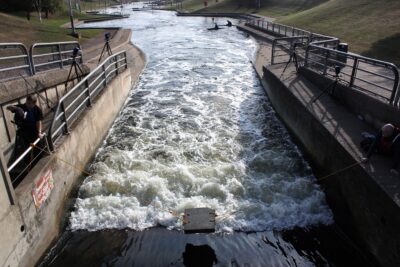
Figure 10. L shaped calibration frame ‘hovered’ above the water surface
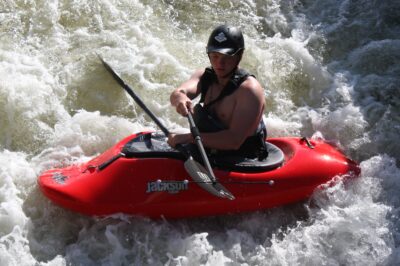
Figure 11 – Boat based wand calibration frame.
One calibration method was used with the SIMI system. This was conducted at the ‘no flow’ condition and utilised a QF-26 lightweight radiation type 3D calibration frame held such that the centre of the calibration frame was approximately at the height of the wave surface (figure 12).
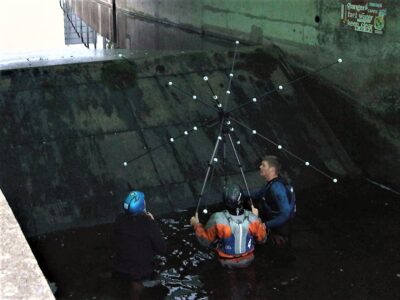
Figure 12. SIMI calibration frame in the no flow condition
The cameras for Simi and Cortex were positioned around the inlet gate feature (as shown in Figure 13). Eight raptor-e cameras were positioned either side of the inlet gate wave feature. An additional video camera was utilised to provide a pictorial reference video to accompany the Cortex infra-red data. This was located at the computer station (top right of figure 13).
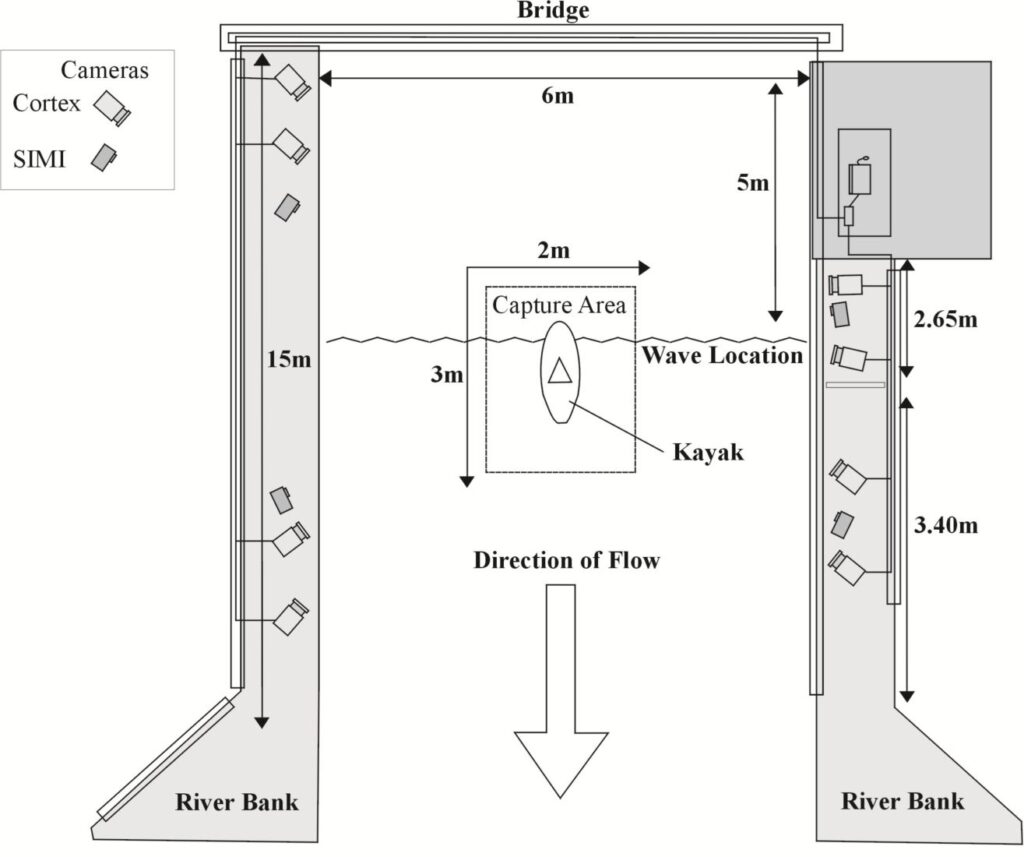
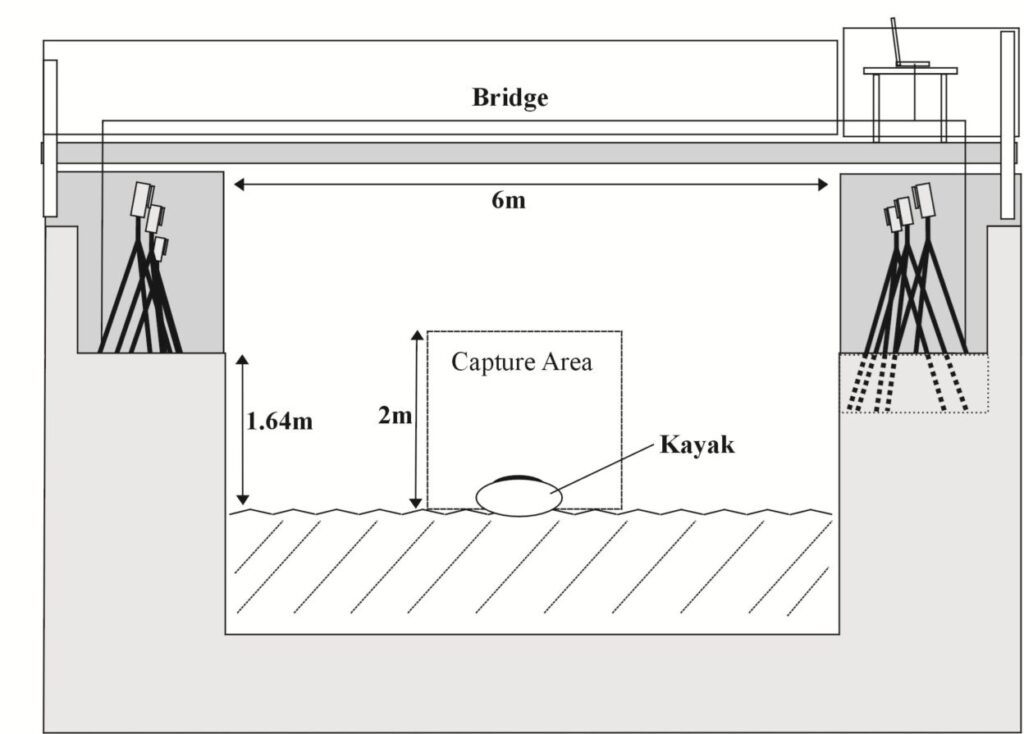
Figure 13. Diagram showing location of Cortex and SIMI cameras at HPP white water course inlet gate.
The raptor-e cameras were set for a frame rate of 100fps. These were operated on a automatic start system such that when one camera was operated all other cameras (including the reference data video camera) began recording. The SIMI footage utilised four Casio EX-F cameras operating at a frame rate of 60fps.
The participant completed a 10min warm up on land prior to kayaking, and once in the kayak had approx 2mins to become familiar with the feature. Each participant was requested to give the “Go” signal when they were ready to complete a kayak front loop. This front loop motion was recorded simultaneously by the SIMI and Cortex systems to allow comparison of data.
As there was not a Gen-lock device available for use with the Casio EX-F cameras during filming, individuals were located at each camera to start filming as the signal was given. Each participant completed three front loops, giving the ‘Go’ signal prior to each loop. Following execution of the three loops the athlete completed a warm down for five minutes.
Periodically, between trials, silicon was re-applied to the markers on the kayaking clothing, paddle and kayak.
Data Analysis
The camera data (from the Casio EX-F cameras) was analysed using SIMI to evaluate hip, shoulder, elbow and wrist angles for the freestyle front loop action. The hip angle was the angle defined by the shoulder, left hip and the kayak. This assumed that the line of the kayak was an accurate approximation of the lower body position, although it is realised that the legs are not straight during kayaking but are slightly bent at the knee. The centre of the shoulder was determined manually by estimating the mid-point between anterior and posterior shoulder markers. The same technique was used to determine the location of the elbow joint as the mid-point between the lateral and medial elbow markers, and similarly for the wrist joint as the midpoint between the lateral and medial markers.
The shoulder angle was the angle defined by the neck, and respective shoulder and elbow. The elbow angle was defined by the respective shoulder, elbow and wrist. Markers were identified from initiation forward (to recovery) (Figure 1).
The Cortex data was analysed used the following marker sets; body, paddle and kayak (top and bottom of the bow and stern). Templates were created for each of the marker sets. Cortex calculated the distance between the markers indentified in the template to create a frame of reference for subsequent analysis. Each marker point was given an ID (e.g., top head, left medial wrist). The paddle and kayak were created as ‘props’, which are marker sets associated with rigid bodies.
Cortex processed the marker data and created a representation of the motion. For gaps or mis-interpreted data the linear join, cubic join (cubic spline) and virtual join functions were utilised. Front loop marker data was smoothed with a fourth order Butterworth filter with a cut-off frequency of 6Hz.
Joint centres were utilised to describe the hip, shoulder, elbow and wrist joints. This function utilised the lateral and medial markers to automatically calculate a landmark half way between the two markers. The joint centre location is calculated using;
C = Lm + p(Mm – Lm)
Where; C is the location of the joint centre, Lm is the lateral join marker, Mm is the medial joint marker, p is the percentage offset between lateral and medial joint markers.
Cortex data was used to calculate the neck, shoulder, elbow and wrist angles. The neck angle was defined as the angle between the top of the head, the neck (calculated as the mid point between the shoulders) and the shoulder. The shoulder angle was defined as the angle between the neck and the relevant shoulder and elbow. The elbow angle was defined as the angle between the relevant shoulder, elbow and wrist. The wrist angle was defined as the angle between the relevant elbow, wrist and knuckle.
The experimental result data was analysed using excel and the SPSS (Statistical Programme for the Social Sciences) computer programme. The paired student t-test was used to compare data from the marker coating testing and demonstrate whether there was a statistically significant difference between the observed results.
Results
The initial testing also highlighted the importance of reflective items that individuals would normally wear (such as reflective tape, reflective buckles and logo badges integral to buoyancy aids etc) which may be detected by the system and impact on results.
The data from both Cortex and SIMI was reviewed. Both systems recorded the kayak front loop motion and provided data to describe the motion. Due to anomalies in the data collected (detailed in the discussion) only one data set was compared for the SIMI and Cortex systems. This data utilised the same participant (male, aged 34) for consistency.
The average percentage of the markers that were observed during the motion was determined for the participant for both SIMI and Cortex. A comparison of the data for SIMI and Cortex is shown in Table 2.
Table 2. A comparison of the percentage of markers visible during a freestyle kayak front loop using the SIMI and Cortex systems.
|
Body Segment |
SIMI (% markers visible) |
Cortex (% markers visible) |
|
Head (top) |
54 |
91 |
|
Head (right) |
44 |
89 |
|
Head (left) |
44 |
92 |
|
Right posterior Shoulder |
46 |
48 |
|
Right Left Elbow |
59 |
97 |
|
Right Lateral Wrist |
25 |
11 |
|
Right knuckle |
40 |
79 |
|
Right Medial Wrist |
18 |
32 |
|
Right Medial Elbow |
24 |
75 |
|
Right anterior Shoulder |
13 |
39 |
|
Right buoyancy strap |
39 |
80 |
|
Right front |
15 |
50 |
|
Right lower front |
0 |
32 |
|
Right lower back |
24 |
67 |
|
Right back |
56 |
94 |
|
Left Posterior Shoulder |
49 |
73 |
|
Left Lateral Elbow |
55 |
90 |
|
Left Lateral Wrist |
44 |
27 |
|
Left knuckle |
31 |
69 |
|
Left Medial Wrist |
8 |
41 |
|
Left Medial Elbow |
16 |
72 |
|
Left Anterior Shoulder |
3 |
57 |
|
Body Segment |
SIMI (% markers visible) |
Cortex (% markers visible) |
|
Left buoyancy strap |
35 |
62 |
|
Left front |
16 |
54 |
|
Left lower front |
13 |
27 |
|
Left lower back |
18 |
69 |
|
Left back |
44 |
95 |
Due to the rotational nature of the motion in the anterior posterior axis there are periods where parts of the body and kayak will be obscured. However, with the exception of the left lateral wrist, the right lateral wrist and the right posterior shoulder the percentage of markers observed by Cortex was consistently higher than that observed by SIMI. These results are based on raw data and do not include any software manipulation to account for predictions of marker locations. The overall average percentage of participant markers visible was 63% for Cortex and 37% for SIMI. This would indicate that the Cortex system was more effective at allowing identification of the markers, potentially related to the increased number of cameras utilised.
The individual data points were averaged to provide anterior / posterior data.
Table 3. Comparison of anterior / posterior marker visibility during a freestyle kayak front loop.
|
Simi (% markers visible) |
Cortex (% markers visible) | |
|
Head |
47 |
91 |
|
Paddler posterior |
48 |
75 |
|
Paddler anterior |
10 |
43 |
As anticipated the posterior markers had a higher percentage visibility than the anterior markers for both Simi and Cortex. This is consistent with the nature of the motion in which the participant utilises a forward tucked position as in diving which obscures the anterior markers.
The paddle and kayak marker data was correlated from the SIMI data (table 4).
Table 4. Paddle and kayak marker visibility during a freestyle kayak front loop.
|
Marker location |
SIMI (% markers visible) |
|
Bow Upper |
20 |
|
Bow Lower |
4 |
|
Stern Upper |
54 |
|
Stern Lower |
29 |
|
Paddle right (front) |
35 |
|
Paddle right (back) |
27 |
|
Paddle left (front) |
31 |
|
Paddle left (back) |
39 |
The kayak and paddle markers were visible during the front loop motion. As expected the underside of the kayak was less visible that the upper kayak, with the bow being the least visible section of the kayak (visible for 4% of the motion), being immersed for the set up and initiation of the loop.
The paddle markers were on average visible for approximately a third of the duration of the loop (31% for the right side of the paddle and 35% for the left side of the paddle). It was anticipated that these would be similar as the paddle stroke is approximately symmetrical during the motion.
Shoulder, hip, elbow, wrist and neck angles were obtained from both Cortex and SIMI at key points in the freestyle kayak front loop motion (relating to the initiation phase (the point when the bow enters the water), the maximum extension toward the stern of the kayak and take off (the point where the bow is released)). These shoulder, hip, elbow, wrist and neck angles are shown in tables 5 and 6.
Table 5. Hip, shoulder, elbow and wrist angles obtained from SIMI data
|
Left Shoulder angle (º) |
Left Elbow angle (º) |
Left Wrist angle (º) |
Left hip angle (º) |
Right Shoulder angle (º) |
Right elbow angle (º) |
Right Wrist angle (º) |
Right hip angle (º) | |
|
Set-up (Neutral position) |
137 |
136 |
137 |
92 |
146 |
92 |
139 |
114 |
|
Maximum lean back (pre-initiation phase) |
141 |
124 |
157 |
78 |
117 |
107 |
144 |
81 |
|
Initiation (Bow submerged) |
158 |
129 |
144 |
147 |
155 |
132 |
141 |
153 |
|
Maximum extension |
152 |
157 |
146 |
23 |
150 |
157 |
160 |
29 |
|
Take-off (Bow release) |
160 |
94 |
148 |
102 |
100 |
132 |
171 |
110 |
Table 6. Shoulder, elbow, wrist and neck angles obtained from Cortex data.
|
Left Shoulder angle (º) |
Left Elbow angle (º) |
Left Wrist angle (º) |
Left hip angle (º) |
Right Shoulder angle (º) |
Right elbow angle (º) |
Right Wrist angle (º) |
right hip angle (º) |
Head / neck angle (º) | |
|
Set-up (Neutral position) |
160 |
112 |
143 |
133 |
69 |
161 |
17 | ||
|
Maximum lean back (pre-initiation phase) |
150 |
125 |
136 |
164 |
77 |
160 |
38 | ||
|
Initiation (Bow submerged) |
165 |
103 |
135 |
172 |
96 |
129 |
9 | ||
|
Maximum extension |
139 |
150 |
124 |
136 |
152 |
119 |
23 |
The exact time of initiation (bow release) was not known for Cortex as, due to difficulties in identification of the boat markers, it was not possible to identify the timing of the bow release from the Cortex infra-red marker data. The pictorial reference video was difficult to utilise and of poor quality such that it was not possible to identify the exact time of initiation from the video. Data for the body motion within Cortex was available after the point of maximum extension although the location of the kayak could not be quantified using the markers.
Both the Cortex and SIMI systems provided kinematic data of the freestyle front loop. This demonstrates that Cortex can be utilised in an external white water environment, however there were several limitations identified which are reviewed in detail in the Discussion section.
The hip motion described by the SIMI data (tables 5 and 6, and figure 14) matched that expected from observation of the front loop. The participant was initially in what is referred to as the ‘neutral’ position as they approached the wave feature, with a left hip angle of 92º. The right hand side hip angle was slightly higher at 114º, which represented the participant taking a forward paddling stroke and the body being twisted (i.e., which would result in a greater observed angle between the right shoulder, hip, and kayak).
The participant then leant backwards towards the stern slightly (with a hip angle of 78º measured on the left side and 81º measured on the right side). This was consistent with the motion of the participant slightly lifting the bow prior to its submersion. To submerge the bow at initiation the participant leant forward (with a hip angle of 147º measured on the left side and 153º measured on the right side). As the resultant buoyancy force drove the kayak and participant into the air (take-off), the participant adopted the maximum lean towards the stern (with a hip angle of 23º measured on the left side and 29º measured on the right side). The participant then moved to a more tucked position to initiate the loop (with a hip angle of 100º measured on the left side and 110º measured on the right side).
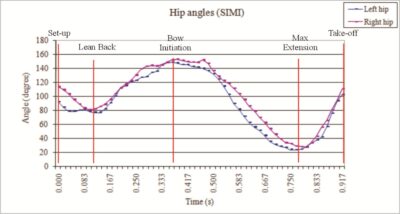
Figure 14. Hip angles observed during phases of freestyle kayak front loop determined using SIMI and Cortex.
Hip angles were not available from Cortex for the same range of motion as the kayak markers were obscured in the sample analysed. This is further detailed in the discussion and limitations sections.
The neck angle (obtained from Cortex) (figure 15) was measured as the angle between the top of the head, the neck (calculated as mid point between the two buoyancy aid shoulder straps) and the mid point of the back (calculated as the mid point between the left lower front and right lower back markers). The neck started slightly forward at an angle of 17º in the neutral position. As the kayaker leant back slightly prior to submersion the head was tilted further forwards to 38º. This was possibly to compensate for the backwards lean (the orientation of the body had changed by 14º) or possibly as the participants view changed to focus on the wave. As the bow entered the water at initiation the participant’s neck angle was 9º, at this time the participant had adopted a more neutral neck position as they leaned forwards. As the resultant buoyancy force drove the kayak and participant into the air the participant had a neck angle of 23º. The forward tilt of the head represented the participant looking forward to the wave as the kayak was moving vertically and preparing for the tucked position to initiate rotation.
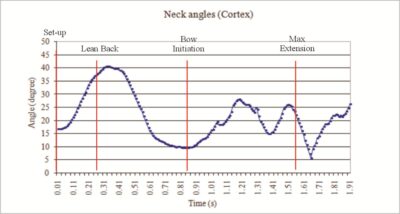
Figure 15. Neck angles observed during phases of freestyle kayak front loop determined using SIMI and Cortex.
The shoulder, elbow and wrist angles from SIMI and Cortex are shown pictorially below (figure 16 and 17)
.

Figure 16. SIMI representation of upper body motion during freestyle kayak front loop.

Figure 17. Cortex representation of upper body motion during freestyle kayak front loop.
Both SIMI and Cortex described a similar pattern of motion. They clearly demonstrated the major phases of motion; set-up, initiation and take-off phases (e.g., the neutral position, the lean forwards during submersion of the kayak bow, the maximum extension as the kayak moved vertically under the resultant buoyancy force, and the tucked position during flight).
For all cases (except the SIMI left shoulder) the largest shoulder angle (observed at the key points) occurred at the point where the bow entered the water (initiation) and the participant was at the maximum lean forward towards the bow of the kayak. The general pattern of shoulder motion observed was that the shoulder angle increased from the neutral position to the point when the bow enters the water, the shoulder angle then decreased and rapidly increased prior to maximum extension, the shoulder angle then decrease for maximum extension and take-off (bow release) as the body adopted the tucked position (figure 18).
The graphs (figure 14, 15, 18, 19, and 20) show the continuum of hip, shoulder, elbow, wrist and neck motion during the time from set-up to take-off (the bow leaving the water) and the flight phase of the front loop motion beginning.
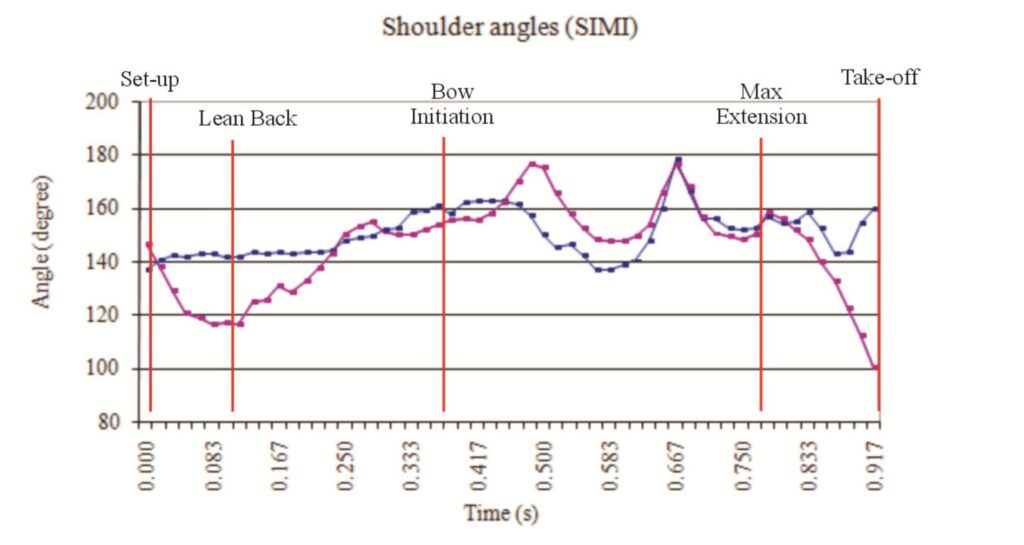
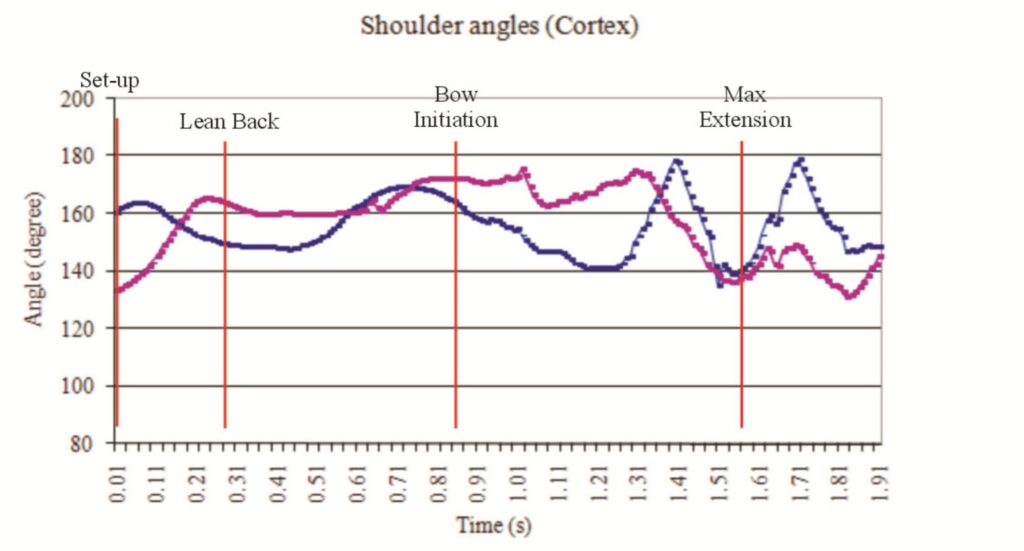
Figure 18. Shoulder angle observed during phases of freestyle kayak front loop determined using SIMI and Cortex
There are several similarities in the pattern of motion between SIMI and Cortex. For the shoulder motion the maximum shoulder angle peaks at 175º in Cortex and 178º in SIMI prior to the maximum extension (toward the stern of the kayak) as the kayak moves upward under the resultant buoyancy force. The time between the maximum shoulder angle and maximum extension was 0.1s from SIMI and 0.25s from Cortex.
For all cases (both SIMI and Cortex) the maximum elbow angle (observed at the key points detailed in tables 5 and 6) occurred at the maximum extension (as the kayak moved vertically under the resultant buoyancy force). The elbow angles at maximum extension were comparable for both the left (150º from Cortex and 157º from SIMI) and right (152º from Cortex and 157º from SIMI) elbows. It was also noted that the elbow angles were uniform between left and right for SIMI (157º for both left and right) and Cortex (150º left and 152º right) indicating that at the point of maximum extension the elbow angles were similar (as observed visually by the body symmetry at this point). Graphs of elbow angle with time for both SIMI and Cortex show that in general the elbow angles do follow a predictable pattern although this was not noticeable at the key points considered.
The elbow motion (figure 19) generally followed a pattern of increasing to the point just prior to initiation (when the kayak bow submerged) and then decreasing before rapidly increasing to the maximum at the point of maximum extension. This represented the arm flexion as the participant leans forward to initiate the motion, then straightens and extends the arms, before entering the tucked position to initiate rotation.
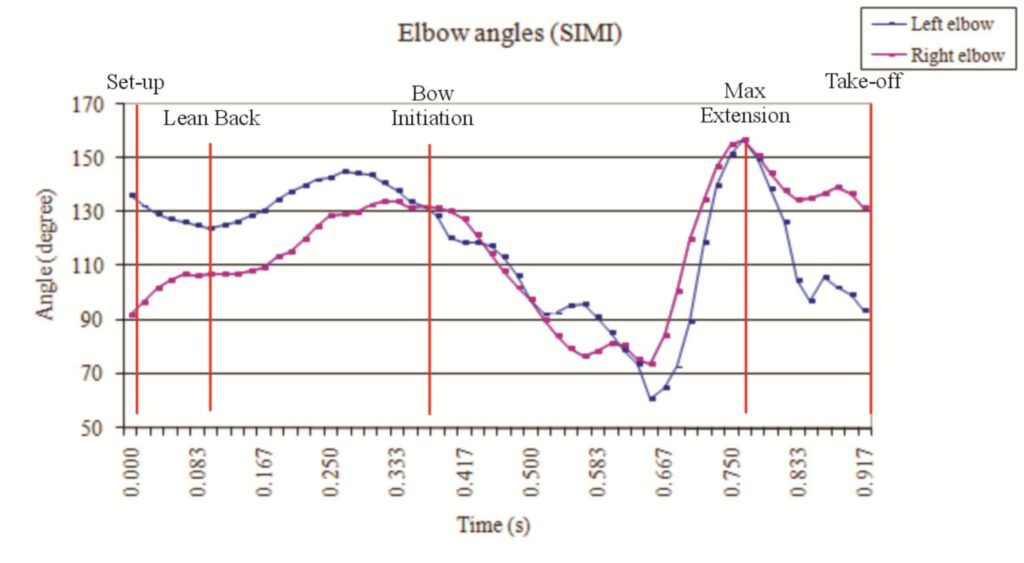
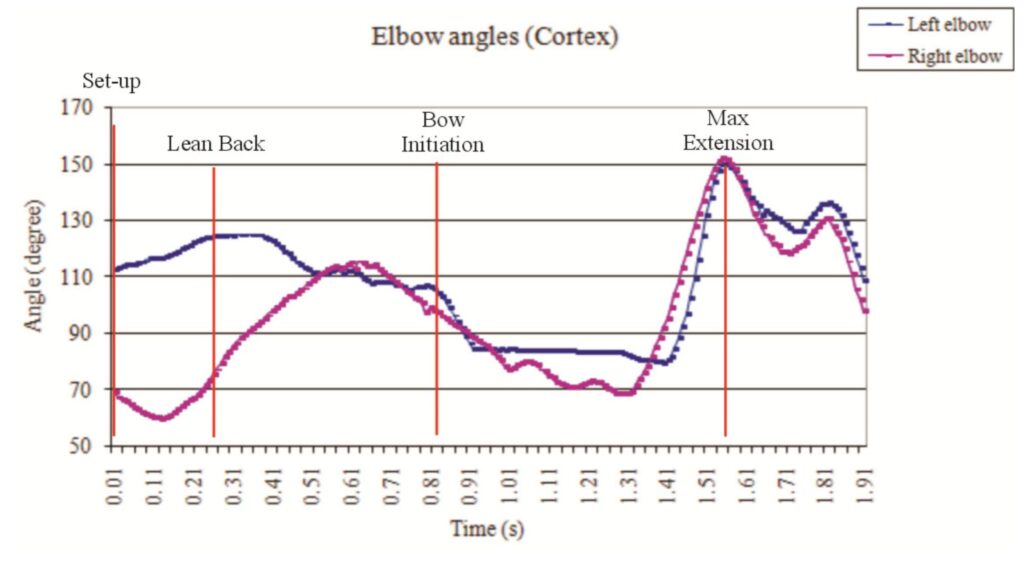
Figure 19. Elbow angle observed during phases of freestyle kayak front loop determined using SIMI and Cortex
There was no observable pattern noted, at the key motion points identified, for the wrist angles between both SIMI and Cortex or between the left and right wrists (figure 20).
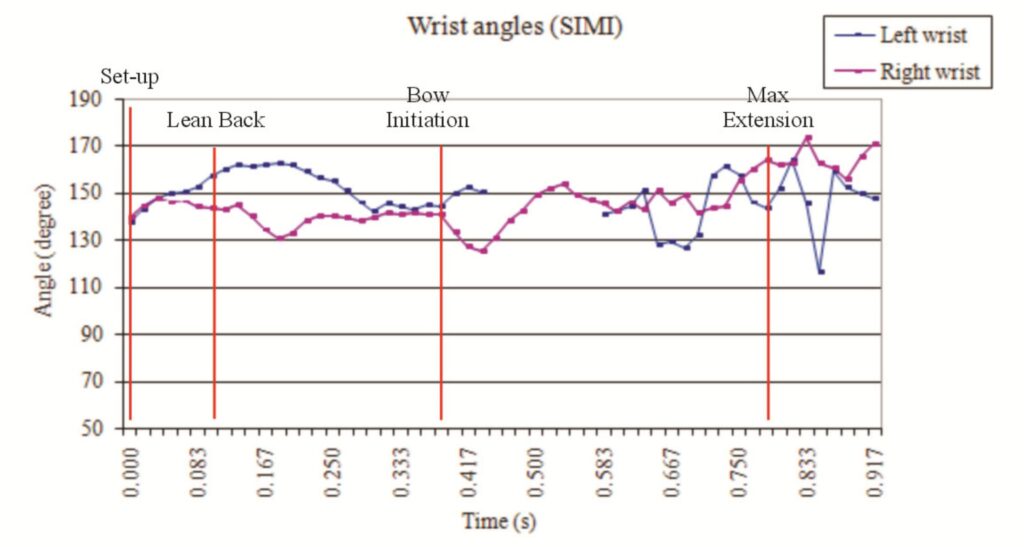
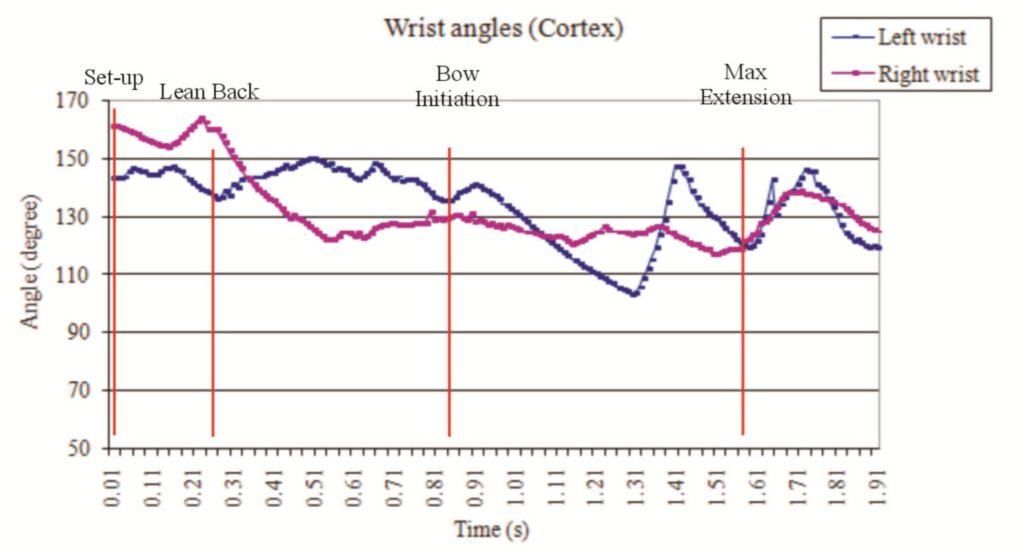
Figure 20. Wrist angles observed during phases of freestyle kayak front loop determined using SIMI and Cortex.
Discussion
The study aimed to investigate if it was feasible to conduct automated 3D motion capture to obtain kinematic information on a freestyle kayak front loop in an outdoor environment. The research identified that it was possible to obtain 3D optoelectric motion capture in an external environment which could then be analysed and used for coaching purposes. (Although it is realised that this research used a small data sample and further research is required with a larger data set). This research supports work by Hatfield and Scheirman (2010) who suggested that optoelectric systems could be utilised in an outdoor environment (although they consider its use for golf analysis).
Both the Cortex and SIMI systems provided 3D kinematic data of the freestyle front loop. For both systems the kinematic data was limited to the initial motion prior to the recovery phase. The Cortex system tracked the motion for a longer time period than the SIMI system. For the SIMI system, after the point of take-off (during flight), it was difficult to track the position of the body (due to the position/elevation of the kayak relative to the SIMI cameras). The body was largely obscured by either the kayak, or, as with the head, partially submerged in water. This meant that it was not possible to obtain meaningful angle data. To obtain more useful data it would be necessary to complete a large clean air loop (paddle not in the water during the loop), where the head is not obscured by the water during the loop. This is not always possible based on the wave configuration. It is also possible that an alternative (lower) camera elevation would have increased the data available from both the Cortex and SIMI systems.
The data that is of most interest to the kayak coach is the initiation of the loop as this sets the parameters of the flight. This initiation data was observable by both systems.
The data available from both SIMI and Cortex identified several similarities in the trending of the shoulder and elbow angles during the freestyle kayak front loop motion. These included the maximum shoulder angle, which occurred at the same point of the front loop motion in both systems, being approximately the same in both cases (175º for Cortex and 178º for SIMI).
It was not possible to obtain a direct comparison between SIMI and Cortex data as the data, whilst using the same participant was from different trials. This was necessary as experimental issues, such as the impact of sunlight and delays in individuals manually beginning filming for the SIMI data precluded the use of much of the data.
Due to the manual techniques required to identify the joint centres in the SIMI footage it is realised that there are likely to be discrepancies in the angle data obtained from SIMI. These errors would not be observed in the Cortex data as the joint centres are automatically calculated from the markers. This is consistent with Richards (1999) who noted that video techniques can have accuracies of 1mm, which could diminish if the system required manual digitisation of the markers
However both the Cortex and SIMI systems are susceptible to movements in the clothing worn which may distort the location of the markers and lead to errors in determining the joint centre locations. The clothing chosen aimed to minimise these anomalies. It was realised that the use of a wetsuit, to minimise marker movement, would have required participants to be of equal size for the wetsuit to be of an adequate fitting to provide the desired benefit. As obtaining participant all the same size was not practicable, this would potentially have required the use of multiple wetsuits for the chosen population. To avoid the error associated with multiple garments it was decided to utilise markers on a buoyancy aid (of standard size common to most kayakers), which was adjustable to provide a close fit for all participants, and elbow pads, which again could be adjusted to provide a tight fit.
It was noted that for the single sample the processing time was comparable for SIMI and Cortex, although it is recognised that the researcher was relatively new to both systems which added to the time taken to analyse the data. For a large volume of data (such as multiple participants) it is realised that Cortex would offer speed benefits in both processing and post processing (e.g., calculation of joint centres).
The calibration frames for the Cortex system were conducted for the ‘with flow’ and ‘no flow’ conditions. For analysis purposes the ‘no flow’ calibration was utilised as this proved to provide the more accurate analysis. It is suggested that to improve calibration in the ‘no flow’ case a stand is used to support the L shaped calibration seed. Additional testing is required to further investigate the use of ‘with flow’ calibration techniques.
Experimental Limitations
During the course of the research there were several areas where it was identified that additional research and further testing were required to improve the use of optoelectric techniques in the white water environment.
The initial full scale testing identified the impact of sunshine and lighting conditions upon the test results. Recognition of the markers by the cortex system was impacted by the reflection of sunlight upon the water surface. The markers were detected in the full sun trial; however the sunlight caused additional noise in the data. These trials was discounted due to the processing time required to remove the noise / manually digitise the data. The noise in the full sun trial precluded the use of the automated data processing (attempts to use the automated data processing resulted in manual interventions to eliminate ghost markers). Additional full scale testing was conducted with a tarpaulin cover arranged across the white water course to minimise the impact of direct sunlight. This is consistent with Hatfield and Scheirman (2010) who suggested that the markers are visible in full sunlight conditions.
It was noted, by visual observation during the full sun versus shaded trials, that the sun did not adversely affect the number of markers observed or the duration for which the markers were visible during the front loop motion. This data would need to be further quantified to confirm that the addition of the tarpaulin did not have a negative effect on detection of the kayak markers.
This tarpaulin impacted on the available camera locations for filming. Initial camera arrangements had utilised both sides of the white water course and the bridge to allow for a greater range of footage. The addition of the tarpaulin arrangement prohibited the use of the bridge as a filming location. This was sub-optimal and for further research at HPP it is advised that an alternative shading arrangement is utilised to allow bridge filming to occur.
For future research it is suggested that the timing of the filming be considered to provide optimum light conditions (i.e., filming in the early morning or evening when the impact of full sun may be reduced). The timing of filming at HPP was limited by availability of the course, as there were periods when the research required sole use of the facility for such as calibration (when it was necessary to stop the water flow).
The tarpaulin was easy to erect at the white water course as there are pre-existing slalom gates that may be used to provide support for the tarpaulin. It was recognised that whilst it might not be impossible, the tarpaulin arrangement would be difficult to arrange in a traditional river setting. The Cortex arrangement with the tarpaulin may offer benefits for further slalom research.
Initial pilot testing investigated the use of coatings to increase the hydrophobic properties of the markers (increase the water shedding properties of the markers). This research had identified that the use of a thin film of silicon lubricant reduced the time taken for the markers to be observed following immersion in water. Although this was the best option identified at the time, the average time taken to observe the markers was 0.04ms.
The pilot trials used a short duration submersion in a stationary water source. Although it was realised that this small scale trial did not fully mimic the full scale test conditions (the water was static) it was the most practicable small scale trial to conduct in the laboratory setting. Full scale field trials identified that following submersion in moving water (as occurs during the loop), the markers were not always visible. This indicates that the water shedding properties of the marker silicon coating observed in the lab environment was not fully mirrored in the external environment. It is possible that this was caused by the moving water having a “washing” effect and removing the silicon coating from the markers.
In addition the laboratory testing used potable water. The water quality observed at the HPP white water course is not clear, potable water quality. This may also have had a negative impact on the detection of the markers, as over a period of time it may have been possible that a thin layer of material was deposited on the marker by the process of evaporation. The markers were not cleaned during the course of the experiment. The pre-defined routine for the application of silicon lubricant to the kayak markers was not always adhered to during the testing. For future research it is suggested that the kayak markers (especially those on the hull of the kayak, which are mostly submerged) should be dried and coated with silicon (and wiped to provide a thin silicon film on the marker) following each trial and any markers with surface damage (abrasion) should be replaced.
Further investigation, utilising moving water conditions, is required to more fully understand the mechanisms affecting detection of the markers following submersion in moving water and the optimum marker coating to minimise this effect.
The kayak paddle markers were located (front and back) at each end of the shaft, where the shaft joins the paddle blade. The paddle was visible for periods of the looping motion, such as take-off and flight, when it was not submerged. However, as the markers were occasionally submerged (and not visible) when the associated paddle blade was in the water this was not the optimum configuration. For further research it is suggested that the marker be retained at the original locations and in addition markers are added close to the mid point of the shaft (two markers on one side and one on the other, with the positions offset to make a low angled V shape).
The kayak markers were initially placed local to the tip of the bow or stern. In later data collection the markers were moved to the locations shown in figure 6 to be more evenly spread between the cockpit and the tip of the bow / stern. It is unclear if these markers were detected for a higher percentage of the loop than the markers located closer to the tip. The optimum location of the kayak markers should be investigated in future research.
To facilitate hip angles to be obtained utilising the Cortex system it is suggested that markers are added to the kayak such that it is possible to obtain the hip and knee joint centre from the marker locations. This would allow calculation of the hip and knee joint locations and subsequent analysis of the hip motion.
The footage from both the raptor-e (cortex) and the Casio EX-F (SIMI) cameras relied on human intervention to start the filming. An individual was located at each camera to start filming upon the ‘Go’ instruction from each participant. This resulted in several front loops where, due to communication issues and other distractions, not all of the footage was available from each camera. Several of the front loops were discounted due to lack of available data (from either Cortex or SIMI). It is suggested that for future reference a Gen-lock camera arrangement is used to automatically start the cameras at the same time to avoid these anomalies. If the gen-lock facility is not available it is suggested that a strobe light (or similar) be used to synchronise the cameras used to record the SIMI data.
Future Research
This research opened several avenues of future research. Whilst there are several issues to address (primarily the visibility of markers following submersion in water), the research demonstrated the possibilities for the use of a passive optoelectric camera system in an outdoor white water environment.
Having confirmed that it is possible to complete 3D biomechanical analysis of freestyle kayaking in a white water environment there are several other water based kayak sports that would benefit from 3D analysis. On example would be slalom where it is suggested that it would be possible to conduct research such as that of conducted by Hunter (2009) to evaluate the canoe trajectory while negotiating an upstream gate in an external environment. Slalom is a more surface based water sport (involving less kayak submersion), which would lend itself to the analysis using an optoelectric system with a suitable controls to minimise the impact of direct sunlight.
From a freestyle kayak perspective, it is suggested that aspects such as the visibility of markers following submersion in water is further researched. The front loop research should then be repeated with a larger data set to confirm validity and repeatability.
Upon successful conclusion of this research it is suggested that the modelling of the front loop be repeated using members of the GB freestyle kayak team. The research could investigate similarities and differences between looping techniques adopted by male and female participants and how coaching methods can be optimised to account for any differences.
Research could also be conducted to validate the assumption that the freestyle kayak front loop is analogous to the diving motion. This research could include investigating the effect of the arm / body position during the front loop and comparing this to data from diving research (Hay, 1985; Miller and Munro,1985; Hamill, at al, 1986). It is proposed that three variations of the front loop could be considered;
- Full flexion of the arms through-out take-off and flight,
- Full flexion of the arms during take off, and shoulder abducted to 90 º, externally rotated to 90º (in the frontal plane) and the elbow flexed to 90º for flight and landing.
- Arms remain stationary, shoulder abducted to 90º, externally rotated to 90º (in the frontal plane) and the elbow flexed to 90º, during the take-off and flight phases.
In the short term investigations are likely geared towards research (designed to develop principles on which good performance is based), although the emphasis should move to servicing (aimed at directly improving the athletes being tested) once the techniques are proven.
References
Baker, J., Sanders, R, Rath, D. & Kelly, B. (1999). A three-dimensional analysis of male and female elite sprint kayak paddlers. In R Sanders & B. Gibson (Eds.) Scientific Proceedings of the XVI/International Symposium on Biomechanics in Sports, 53-56. Perth, WA
Begon, M., Lacouture, P., Colloud, F., (2008), 3D Kinematic comparison between on-water and on ergonometer kayaking, ISBS conference 2008, 502-505.
Carr, G., (2004), Sports Mechanics for Coaches, Champaign, IL: Human Kinetics
Greaves, J. O. B., (1983) State of the art automated motion tracking and analysis systems. SPIE high speed photography, Videography and Photonics, 693, 277-279.
Hamill, J., Richard, M. D., Golden, D. M., (1986), Angular momentum in multiple rotation non twisting platform dives, International Journal of Sport Biomechanics, 2, 78-87
Hatfield, D. A., Scheirman, G. L., 2010, Validation of an Outdoor-based Passive Optoelectric Motion Capture System, XXVIII International Symposium of Biomechanics in Sports, 86-90
Hay, J.G., Yanai, T., (1995), Predicting the under-water motions of the blade of a kayak paddle from above-water motions of its shaft. Unpublished report to US Olympic Committee and US Canoe and Kayak Team, University of Iowa, US.
Hunter, A., (2009), Canoe slalom boat trajectory while negotiating an upstream gate, Sports Biomechanics, 8, 105-113
Hyysalo, S., 2007, User innovation, design space and everyday practices: Rodeo kayaking case revisited, Proceedings of the Nordic Consumer Policy Research Conference 2007, 1-17
Kuncir, E. J., Wirta, R. W., Golbranson, F. L. (1990), Load-bearing characteristics of polyethylene foam: An examination of structural and compression properties, Journal of Rehabilitation Research and Development, 27, 229-238
Lafortune, M. A., Henning, E., Valiant, G. A., (1995), Tibial shock measured with bone and skin mounted transducers, Journal of Biomechanics, 28, 989-993.
Limota, E., Squadrone, R., Rodano, R., Marzegan, A., Veicsteinas, A., Merati, G., Sacchi, M., (2010), Tridimensional kinematic analysis on a kayaking simulator: key factors to successful performance, Sport Sciences for Health, 1, 27-34.
Luo, Z., Niebur, G. L., An, K., (1996), Determination of the proximity tolerance for measurement of surface contact areas using a magnetic tracking device, Journal of Biomechanics, 39, 367-372.
Mann, R. V., Kearney, J. T., (1980) A biomechanical analysis of Olympic-style flatwater kayak stroke. Medicine and Science in Sports and Exercise, 12, 183-188
Miller, D. I., Munro, C. F., (1984), Body segment contributions to height achieved during the flight of a springboard dive, Medicine and Science in Sport and Exercise, 16, 234-242
Miller, D. I., Munro, C. F., (1985) Greg Louganis’ springboard takeoff: I: Temporal and joint position analysis, International Journal of Sports Biomechanics, 1, 209-220.
Pribanic, T., Peharec, S., Medved, V.,(2009), A comparison between 2D plate calibration and wand calibration for 3D kinematic systems, Kinesiology, 2, 147-15
Richards, J. G., (1999), The measurement of human motion: A comparison of commercially available systems, Human Movement Science, 18, 589-602
Sanders R. H., Wilson, B. D., (1987) Angular momentum requirements of the twisting and non twisting 1.5 somersault dive, International Journal of Sport Biomechanics, 3, 47-62.
Silva, S. P., Sabino, M. A., Fernandes, E. M., Correlo, V. M., Boesel L. F., Reis, R. L., (2005), Cork: Properties, capabilities and applications, International Materials Reviews, 6, 345-365.
Shaprio, R., (1978), Direct linear transformation method for three-dimensional cinematography, Research Quarterly, 49, 197-205.
Takei, Y., (2007), The Roche vault performed by elite gymnasts, Somersaulting technique, Deterministic model and judges scores, Journal of Applied Biomechanics, 23, 1-11.
You must be logged in to post a comment.